Login to Your Account
Go to the login area, enter your ID and password, and sign in to your account.
Access the Premium Tool
Once logged in, navigate to Premium Tools and click Extract Tables from PDF. The premium version is completely ad-free and designed to be fast, clean, and distraction-free.
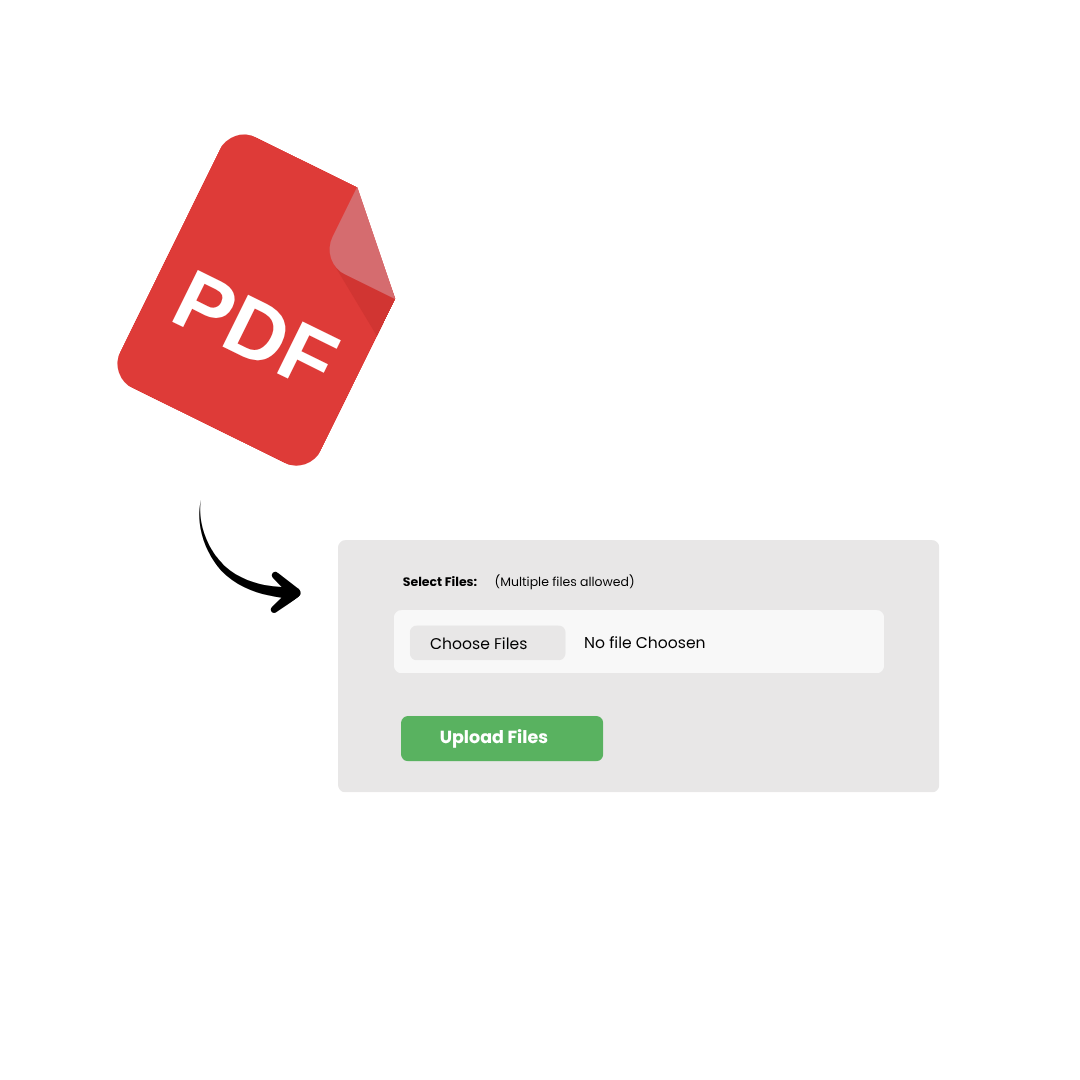
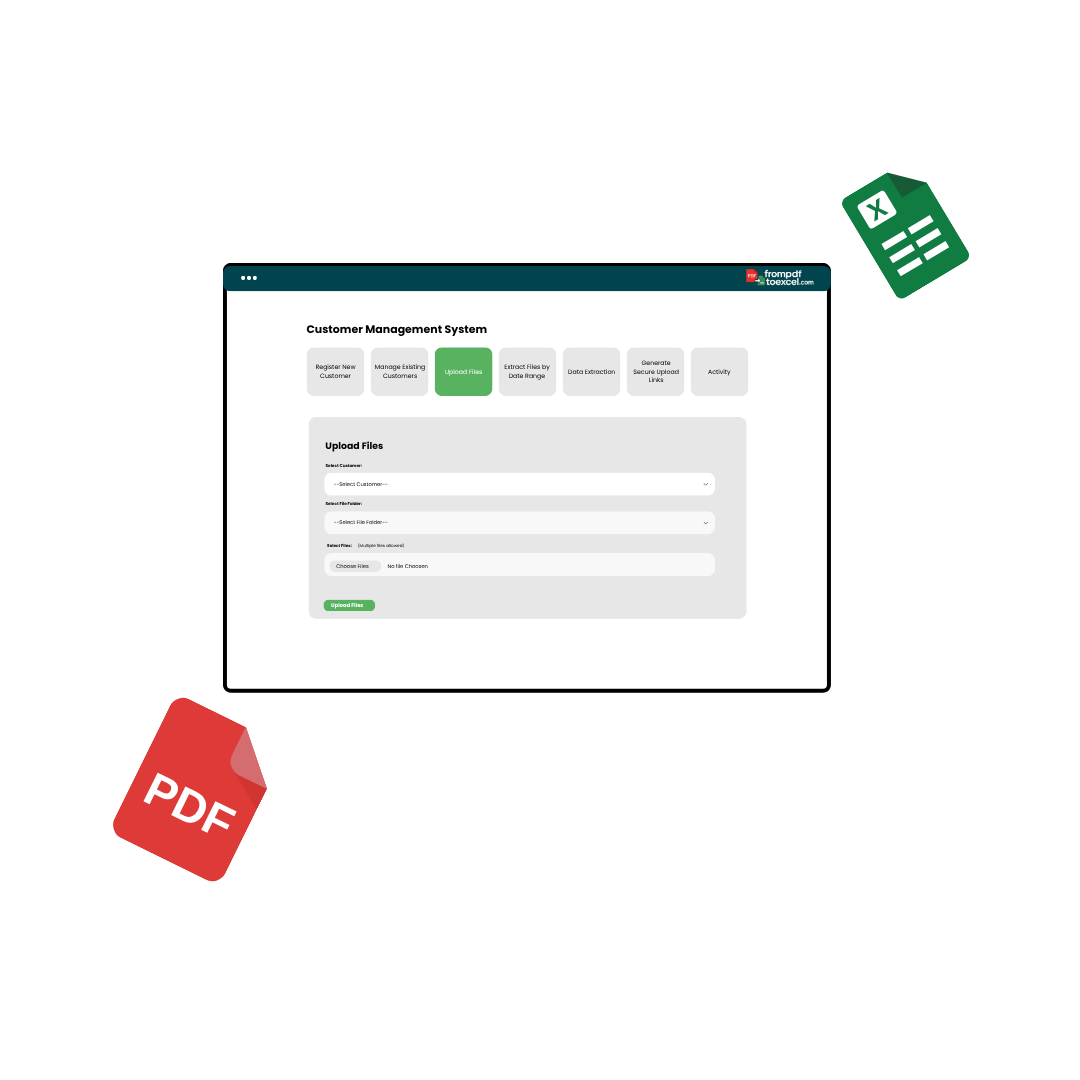
Upload Your PDF
Click Browse, select the PDF file you want to extract tables from, and upload it. Your file will appear immediately on the screen.
Select the Tables
Simply click on the tables you want to extract — whether it’s one or multiple tables across pages.
Extract Instantly
Once your tables are selected, click Extract Tables. Your processed file will download automatically within seconds — no waiting, no external links, and no extra steps.